HIOKI POWER LOGGERS
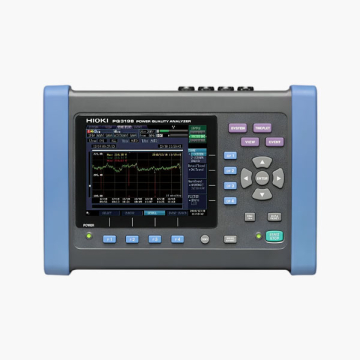
Graph Display Functions
â– Demand Graph Display
Shows the demand value transitions useful for managing power consumption. Check maximum demand values and times while recording.
â– Trend Graph Display
From all measurement items, select one for display.bCheck states such as power fluctuations of devices in on-site operating conditions.
â– Accomodates all Sites
Where no AC power is available : Battery* power provides about eight hours of continuous operation. In addition, a Voltage Line Power Adapter* is available to
power the PW3360-20 from the measurement lines.
In severe temperature environments: The operating temperature range extends from –10°C (14°F) to 50°C (122°F). Even under battery operation, measurements can be performed from 0 °C (32°F) to 40°C (104°F)(0°C (32°F) to 50°C (122 °F) when using LAN communication).
Typical applications are:
Power and energy loggers are used for conducting three phase energy and load studies to discover where savings are possible. With the Fluke Energy Analyze Plus software, it's possible to create detailed power quality and energy reports to focus in on the problem areas.
Weight :
Dimetion :
Cable in one drum:
Pallet weight :
Total net weight in cluding both :



| product brand | HIOKI |
|---|









Validate your login